This article will explain how to measure disk performance and how to interpret the disk performance test result. It will touch upon terminology like IOPS, transfer rate, sequential reading/writing, random reading/writing, and queue number.
About Disk Performance Test
When computer users get a new hard drive disk, they may want to know the specific performance of the hard drive in their computers. To know the specific performance, they need to do a disk performance test.
Besides, if a hard disk has served for a long time, computer users can also run hard drive performance test in their computers to know whether it still works well, because even the same hard drive has different performance in specified computer conditions.
To understand the result of the disk performance test, I have to introduce Input/Output Per Second (IOPS) and Transfer Rate (also called Throughput).IOPS is the number of I/O operations per second. Throughput is the total data transfer volume per second.
Generally speaking, IOPS can be calculated according to the disk rotational speed. The disk rotational speed will indicate the seek time and rotational delay. The calculation formula is as follows: IOPS = 1000 ms / (seek time + rotational delay time).
The IOPS values of common hard drive have already been listed on Wikipedia. Click here to get them.
However, the calculation result is a theoretical value. The real IOPS of a disk in computer will be affected by many factors. But computer users still can refer to it when they buy a hard drive.
To help you to comprehend the above two indexes, I will show you how to measure disk performance. The Disk Benchmark feature of MiniTool Partition Wizard is recommended. This feature is free for computer users and it displays well the relationship between IOPS and Throughput.
How to Measure Disk Performance
MiniTool Partition Wizard is also an SSD benchmark tool. It can not only complete hard drive test but also carry out SSD speed test.
MiniTool Partition Wizard FreeClick to Download100%Clean & Safe
Here is step-by-step guide to disk benchmark in MiniTool Partition Wizard.
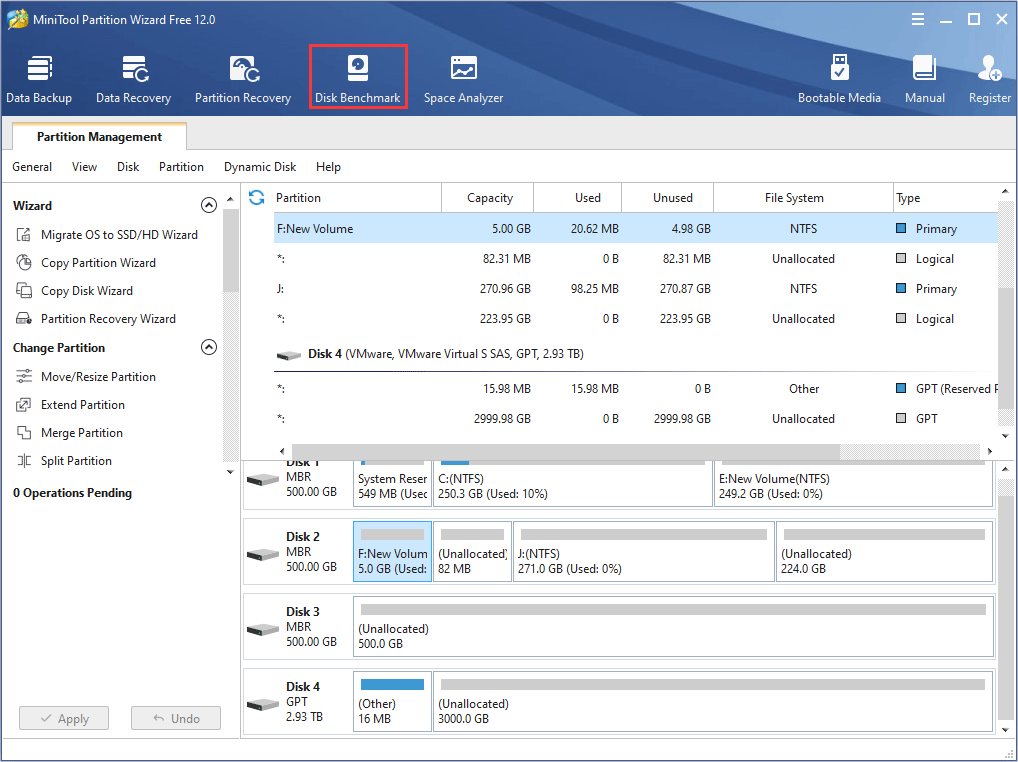
Step 1: Download and launch MiniTool Partition Wizard to get its main interface. And then click Disk Benchmark on the toolbar.
Step 2: Select a drive and set parameters to test the disk performance.
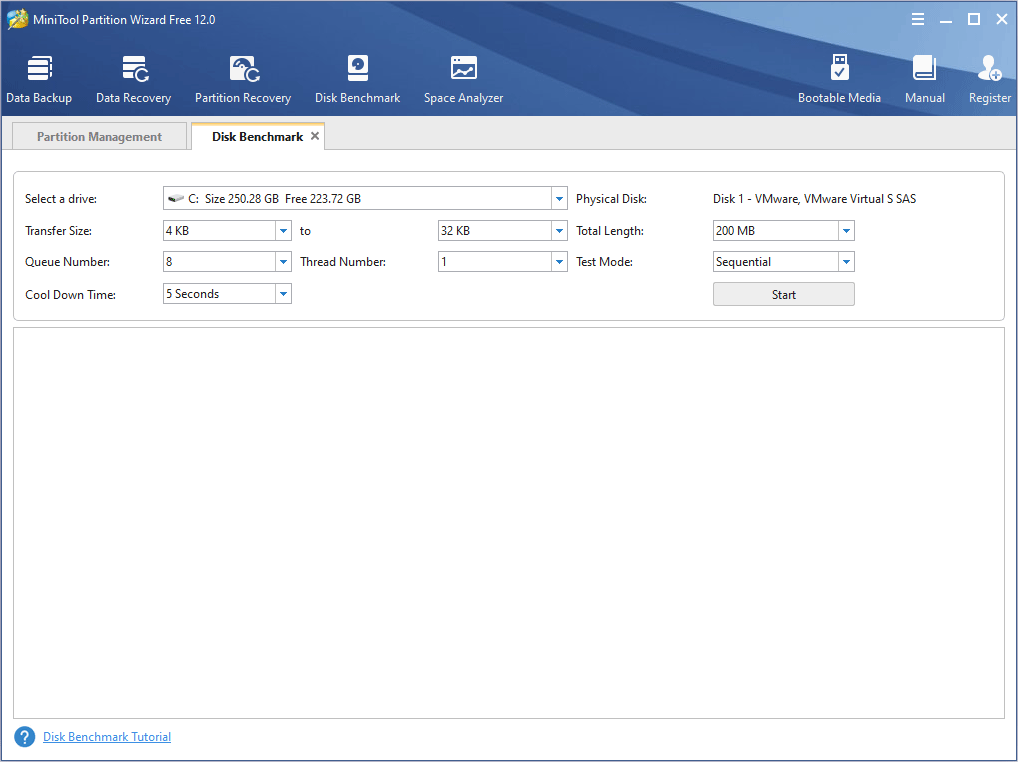
Parameters:
- Select a drive: Computer users select a local disk or a volume to test its performance. The physical disk on where the local disk is located will be listed afterwards.
- Transfer Size: It ranges from 1 KB to 2048 KB.
- Total Length: It ranges from 100 MB to 4096 MB.
- Queue Number: It ranges from 1 to 512.
- Thread Number: It ranges from 1 to 64.
- Test Mode: There are three modes for users to choose: Sequential, Random, and Sequential & Random.
- Cool Down Time: It is used to reduce the hard drive temperature before starting the next test.
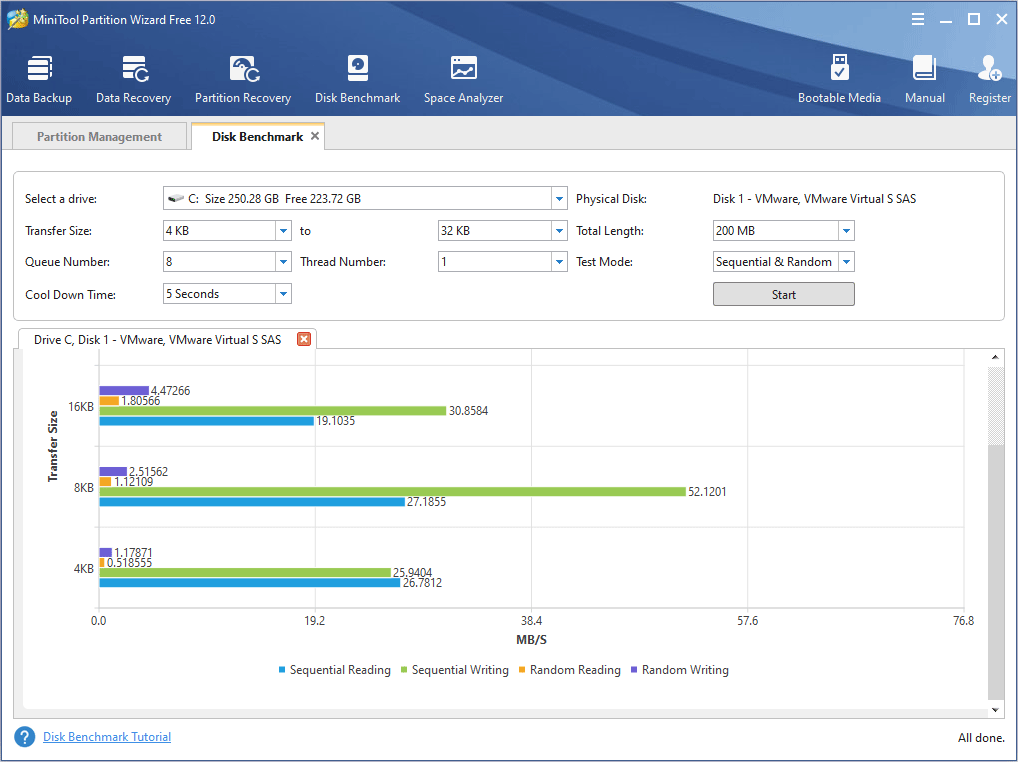
When the above parameters are set, the disk benchmark will show you the read and write speed of the hard drive. The result is shown as follows.
Step 3: Click Start after the parameters are set. Then, wait seconds to get a disk performance test result.
How to Set Parameters in Disk Benchmark
The whole operation process is very simple. But what’s difficult for common users is to decide the parameter values and interpret the result.
Transfer Size
As we all know, data package will be divided into multiple blocks in input or output transmission process. And then these blocks are transferred. So, computer users can determine the block size in data transmission process by setting transfer size value.
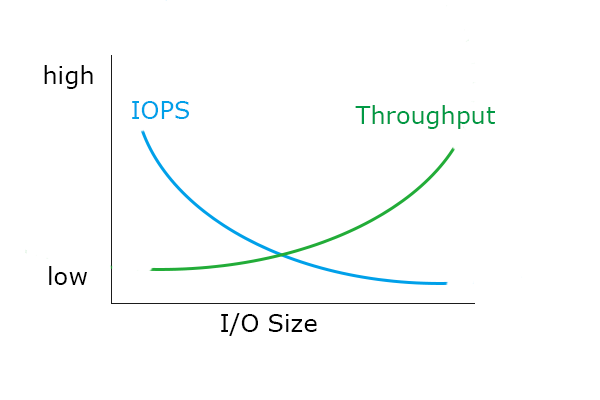
The transfer size will affect the IOPS and Throughput. Generally speaking, there are more IOPS when transfer size is smaller, and there are fewer IOPS if transfer size is larger. Besides, there is a formula about IOPS, Throughput, and transfer size: Throughput = IOPS * Transfer Size.
Generally, bigger IOPS value and big transfer size all can bring in bigger Throughput value to some extent. However, there is an inverse relation between IOPS and transfer size.
For example, as the result picture shows, if the hard drive sequentially reads 200 MB data (total length) with 4 KB transfer size, the disk has a sequential reading speed at 33 MB/S. Then the corresponding sequential read IOPS = 33MB / 4KB.
If calculating IOPS one-by-one, it’s found that the IOPS values are about 8000, 7000, 5000, respectively when the transfer size are 4 KB, 8 KB, 16 KB, respectively. However, it is also found that the disk read/write speed (Throughput) is lowest instead when the IOPS value is biggest.
So, computer users should know what value is important.
Actually, when testing the performance of HDD, computer users should pay attention to Throughput value in sequential reading/writing mode with big transfer size. Otherwise, when testing the performance of SSD, computer users should pay attention to IOPS value in random reading/writing mode with small transfer size.
However, due to advanced format technology, 4K alignment can improve disk performance greatly. So, the transfer size value is usually a multiple of 4 KB. So, when running the disk performance test, it is suggested for common computer users to select 4 KB as the minimum value.
Besides, if computer users often run applications with frequent random reading and writing requests like OLTP (Online Transaction Processing), IOPS is an important index. If computer users often run applications with frequent sequential reading and writing requests like VOD (Video On Demand), they should pay more attention to Throughput value.
Then, what’s the difference between sequential reading/writing mode and the random reading/writing mode?
Sequential Read/Write Mode
It is usually applied in reading/writing big files. These big files are stored on disk sequentially. And they are also read sequentially by read-write heads. Thus, the seek time and rotational delay time are reduced.
Random Read/Write Mode
It is usually applied in reading/writing small files. These small files are usually stored on disk randomly and discretely. When they are read/written by heads, the seek time and rotational delay time are greatly increased. This performance usually affects computer boot speed, large program booting efficiency, file search efficiency and so on.
Surely, the disk speed test in sequential & random mode is closer to life than other modes. This indicator also should not be ignored.
Thread Number
This value is usually related to CPU. It is related to the kernel number of the computer and Hyper-Threading technology.
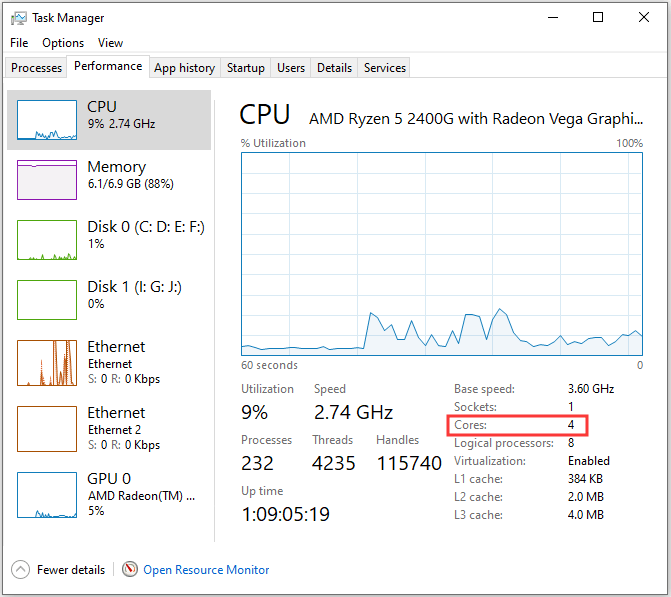
Generally speaking, the thread number is determined by the core number. If your computer has two kernels, then the thread number is two. You can check it in your computer. Right click the taskbar, and select Task Manager. Then navigate to Performance to check Cores number.
However, Hyper-Threading technology (it is a string of codes) can divide a kernel into two threads. And computer operating system will regard one thread as one kernel. Thus, there are more threads to run more programs. Then you can check the real kernel number and thread number through the following way.
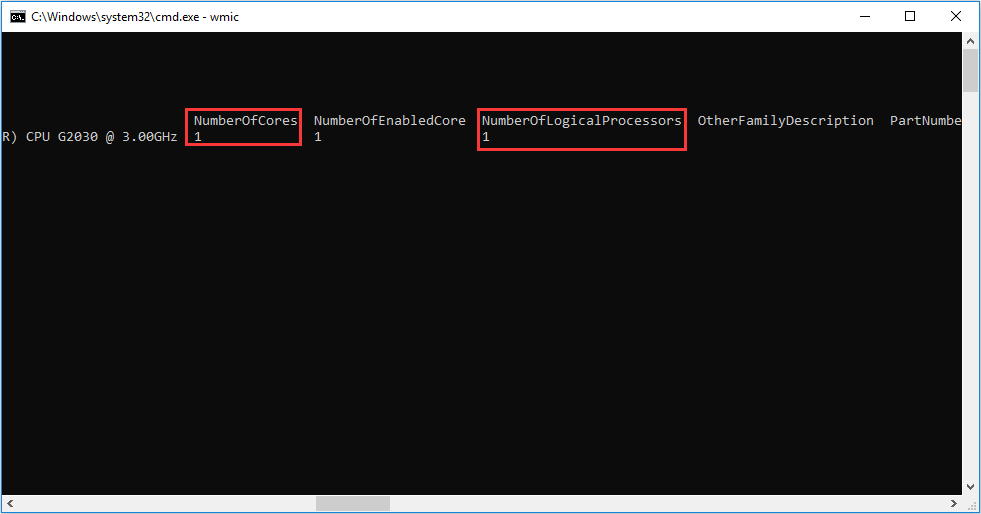
Press “Windows + R” keys and type “cmd” to open the command window. Then type “wmic” and press “Enter” key. And then type “cpu get” and press “Enter” key again. Then you can get the number of cores and number of logical processors (thread).
The hyper-Threading technology can only be applied on Intel CPU. And it can be disabled in BIOS interface.
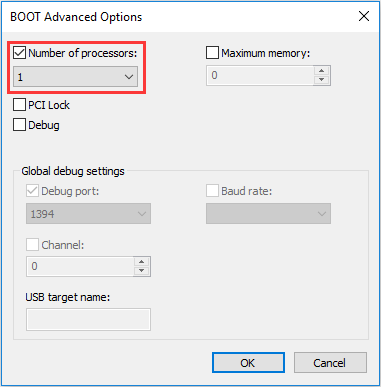
The thread number can be changed by the following steps. Press “Windows + R” keys and type “msconfig”. Navigate to Boot page and click Advanced Options to change the number of processors.
Queue Number
It is the number of I/O requests that are capable of waiting for service in port queue. It touches upon TCQ (Tagged Command Queuing) technology and NCQ (Native Command Queuing) technology. NCQ technology is specially applied in SATA disk. However, TCQ technology is applied more widely.
NCQ and ATA TCQ (PATA, SATA) can support at most 32-class queue length, while SCSI TCQ can support at most 256-class queue length. However, in actual computer operation, the queue length will not exceed 8. (High queue length will increase the I/O response time.)
So, common computer users are suitable to choose a queue length that equals to or is less than 8. Besides, computer users should mainly refer to the disk performance result with queue length that equals to 1. (The commonly defined queue length is 1.)
How to Optimize Disk Performance
Although a hard drive’s theoretical performance is defined, computer users can do many things to optimize the disk performance in actual operation. For example, computer users can defrag Windows and set disk cache.
As for disk defragmentation, please click How to Defrag Windows 7 to Improve Computer Performance to get a detailed guide.
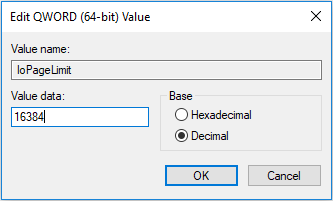
As for disk cache, follow the following tutorial to set up. Press “Windows + R” keys and type “regedit” to open Registry Editor. Navigate to HKEY_LOCAL_MACHINE > SYSTEM > CurrentControlSet > Control > Session Manager > Memory Management to seek the IoPageLimit value.
And then, right click IoPageLimit to modify it. Select Decimal and type cache size in KB. 16384 (16 MB) and 32768 (32 MB) are recommended. Then, save the configuration and restart computer.
Surely, there are other methods that can optimize disk performance, please click Free Hard Disk Optimization Software Helps Optimize Disk Performance to know more.
If the disk has very poor performance and computer users can’t improve it, they should consider buying a new one.
When computer users buy a new disk online, the disk product names are like the following one.
WD Blue 1TB PC Hard Drive – 7200 RPM Class, SATA 6 Gb/s, 64 MB Cache, 3.5. —- A disk product name from Amazon
Hard drive vendors know well that their customers usually take disk performance into consideration when buying a hard drive. So, they will post the basic information about their hard drives like the above one.
We can know the following information from the name. This is a WD Blue PC hard drive. Its rotational speed is 7200 RPM, which will affect disk performance through affecting data access time. Its capacity is 1 TB and its port is SATA 6 Gb/s. It has 64 MB cache and the number 3.5 indicates its physical size.
Conclusion
We hope this article can help you to test disk performance and give you guide to disk purchase. If you have any confusion, please leave a comment below or email to[email protected] for help.
Disk Performance Test FAQ
Disk performance usually refers to the reading and writing speed of the disk. When you buy a disk, most merchants will list the sequential read and write speeds of the disk. However, the true performance of a disk is affected by many factors, so many people like to use free third-party software to measure it themselves.
When measuring disk performance, two factors are important: Throughput and IOPS.
- Download and launch MiniTool Partition Wizard.
- Click Disk Benchmark on the toolbar.
- Select a drive and set related parameters.
- Click Start and wait for the disk performance test result.
About The Author

Position: Columnist
Linda has been an editor at MiniTool for seven years. She continuously learns about computers and puts her knowledge into practice. Moreover, she is particularly knowledgeable in disk management, data recovery, system installation, and PDF editing. Her articles typically reference multiple examples or are based on her own experience, providing users with the most suitable solutions.
User Comments :