About Computer Diagnostic Tests
If a computer serves for a long time, it may have various issues, which will slow down the computer or make it unbootable. Does your computer encounter these problems? If so, you should run a computer diagnostic to detect and fix errors.
Some users would like to run a PC health check. However, this check can’t help you identify specific hardware problems or give you solutions. To identify the specific hardware problem, you need hardware diagnostic tools.
As we all know, all of the parts in a computer will affect its performance. However, what affects the computer performance most is the CPU, the hard drive, and the memory. CPU, memory, and I/O devices (including hard drives) are referred to as the three core components of the computer. If possible, you should run a hardware test tool to diagnose them regularly so that you can make sure they work well.
As for PC diagnostic tools, you can read on to get them. Some of them are PC diagnostic software. The rest of them are built-in Windows utilities.
Here is the list of 5 free and practical computer diagnostic tools
- Intel Processor Diagnostic Tool, used for checking CPU.
- CPU-Z, used for checking CPU.
- Windows Memory Diagnostic, used for checking RAM.
- MiniTool Partition Wizard, used for checking disk.
- Windows Performance Monitor, used for checking system performance.
Checking the CPU
A CPU (Central Processing Unit) is the computing core and control unit of a computer. It mainly includes an Arithmetic Logic Unit, a Controller, a Cache, and a Bus. Its function is mainly to explain computer instructions and to process data in computer software. It is one of the core components of the computer.
Checking the CPU will help you analyze whether it works well on your computer and test its real performance in your computer. So, how can we check the CPU? You can use the following tools.
Intel Processor Diagnostic Tool
The Intel Processor Diagnostic Tool is mainly used to verify the functionality of an Intel microprocessor. It will check for brand identification, the processor’s operating frequency, specific processor features, and perform a stress test on the processor.
If you need this tool, you can click here to download it. Please note that you should choose 32-bit or 64-bit software according to your operating system. Click What Version of Windows Do I Have to identify your OS information.
When you run the Intel Processor Diagnostic Tool, please close all programs and disable Over-Clocking and all power management features because these features or programs will disturb the test result.
Follow the tutorial below to learn more.
Step 1: Set up the Intel Processor Diagnostic Tool.
Step 2: Click Start Test to run PC diagnostic tests.
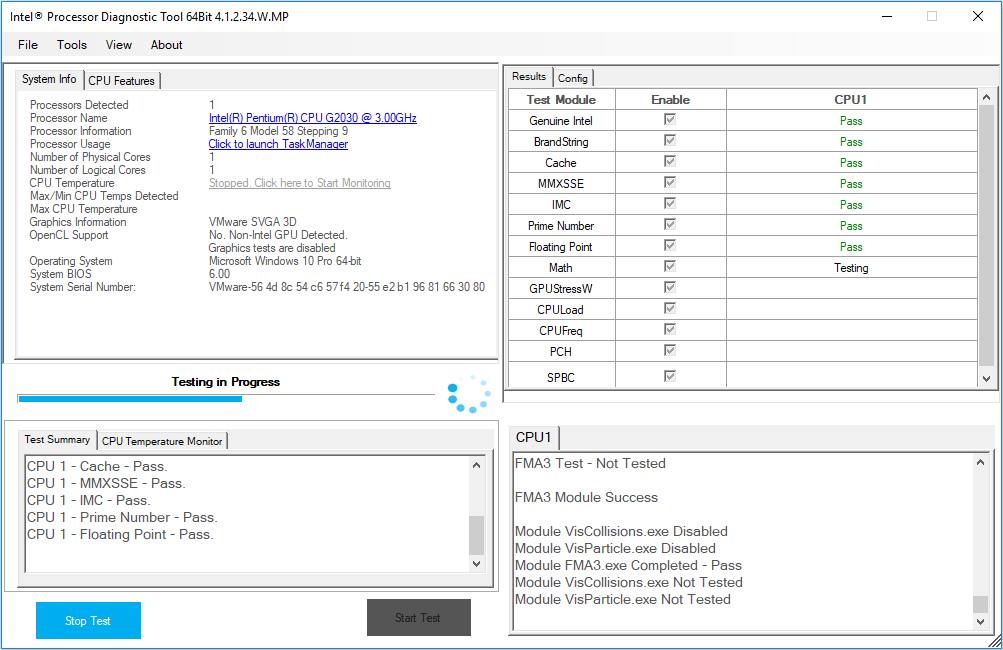
Step 3: Navigate to File > View Results File to see detailed test results. If any test fails, you may need to replace the CPU sooner or later.
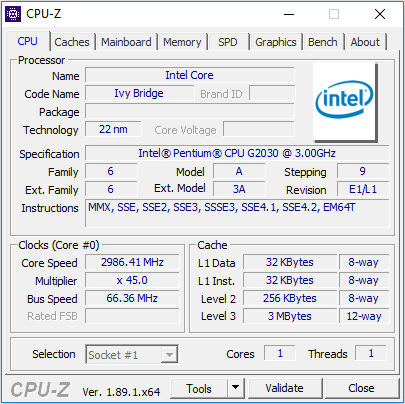
CPU-Z
Apart from the above PC diagnostic software used for checking CPU health, there is also a PC hardware diagnostic tool used for checking CPU performance, which will tell you whether this CPU is suitable for your computer. That is CPU-Z, which supports both 32-bit and 64-bit operating systems.
CPU-Z is equipped with the following features:
- Identifies the category and name of the processor.
- Detects the core frequency of the CPU and the multiplication index.
- Detects the core voltage of the processor.
- Over-Clocking probability detection.
- Detects the instruction set supported by the processor.
- Detects processor first and second level cache information, including cache location, size, speed, and so on.
- Detects part of the motherboard information, including BIOS type, chipset type, memory capacity, AGP interface information.
Follow this next tutorial to learn how to use it.
Step 1: Click here to download it. Launch it and it will monitor your computer automatically.
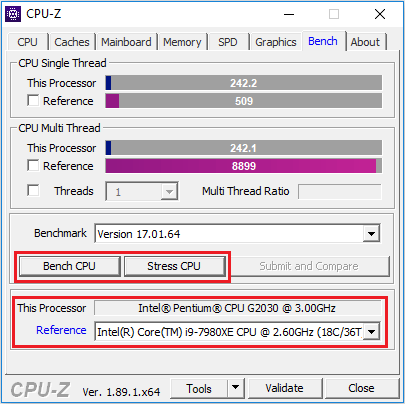
Step 2: Skip to the Bench tab. Then, choose your processor and click Bench CPU and Stress CPU to test its performance.
Checking the Memory
Memory is used to store operational data of the CPU and data that the CPU exchanges with external memory such as a hard disk. The CPU will transfer the data that needs to be calculated into the memory for calculation and the CPU will transfer the result after the operation is completed. The operation of the memory also determines the stable operation of the computer.
If your computer runs slowly or performs unusually, you should check the memory to see whether there are errors.
![Windows 10 High Memory Usage [Causes and Solutions]](https://images.minitool.com/partitionwizard.com/images/uploads/2019/06/windows-10-high-memory-usage-thumbnail.jpg)
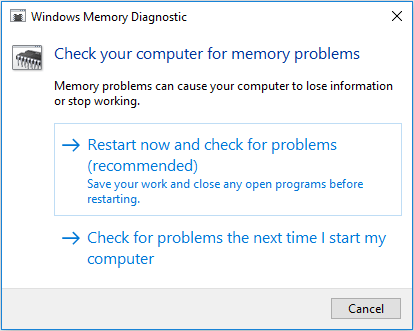
Windows Memory Diagnostic
Windows Memory Diagnostic is a built-in Windows diagnostic tool, which is used for scanning your computer’s physical memory to help identify any issues that may occur. This tool can help you check the stability of the memory bank.
How can the Windows Memory Diagnostic be run? Here is the tutorial.
Step 1: Type “memory diagnostic” in the Windows search box.
Step 2: Double-click the icon of Windows Memory Diagnostic.
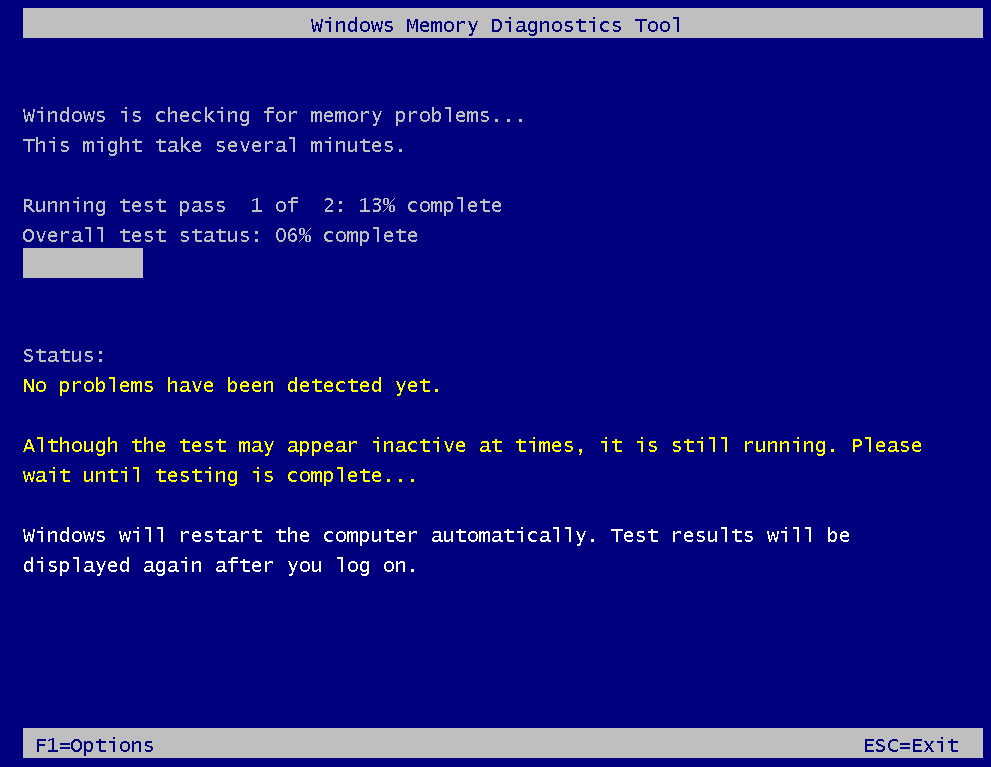
Step 3: Choose Restart now and check for problems.
Step 4: Your computer will restart and diagnose the memory. If you press the F1 key, you can enter a new page to choose diagnosis mode: basic, standard, and extended.
- Basic: The basic tests are MATS+, INVC, and SCHCKR (cache enabled).
- Standard: It includes the basic tests, LRAND, Stride6 (cache enabled), CHCKR3, WMATS+, and WINVC.
- Extended: It includes the standard tests, MATS+ (cache disabled), Stride38, WSCHCKR, WStride-6, CHCKR4, WCHCKR3, ERAND, Stride6 (cache disabled), and CHCKR8.
Step 5: After the diagnosis process is completed, the computer will boot up automatically. Then, you need to view the diagnosis report.
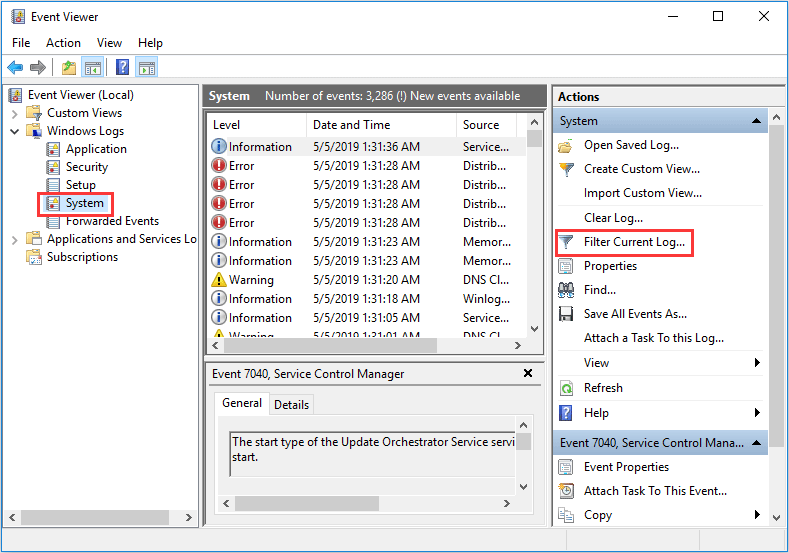
Step 6: Press “Windows + R” keys simultaneously to call out Run box. Type “eventvwr” in Run box and press the Enter key.
Step 7: Navigate to the Windows Logs > System. Then click “Filter Current Log” in the right box.
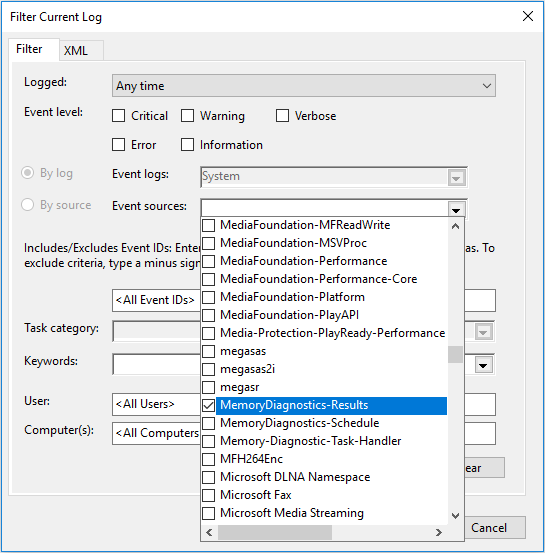
Step 8: Check “MemoryDiagnostics-Results” to display all result logs of the memory test.
Step 9: Double-click the result logs to see the detailed information. After reading them, you can adopt corresponding methods to fix memory problems.
Checking the Disk
A storage device is a type of I/O device. In a computer, hard drives are important for users because they have a great influence on computer performance, user experience, and data existence. You should check the hard drive if the computer often freezes or crashes.
MiniTool Partition Wizard
MiniTool Partition Wizard is professional partition management software. However, it can also check disks for errors and test their performance. It can check file systems, scan for bad sectors, and test write and read speed.
MiniTool Partition Wizard FreeClick to Download100%Clean & Safe
Here is the tutorial on how to use MiniTool Partition Wizard.
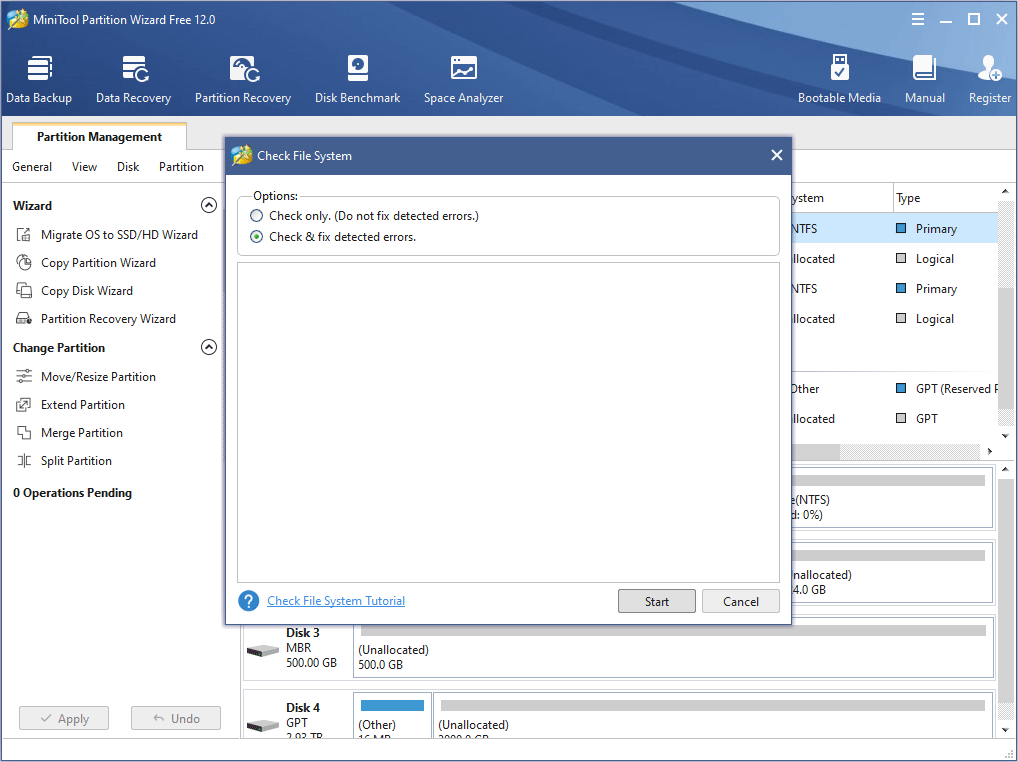
Step 1: Free download MiniTool Partition Wizard and launch it to get to its main interface. Right-click a partition on the hard drive and choose Check File System.

Step 2: Choose Check & fix detected errors and click the Start button. This feature will examine basic file system structures, file name linkages, and security descriptors.
Step 3: Click the Cancel button after the process is completed.
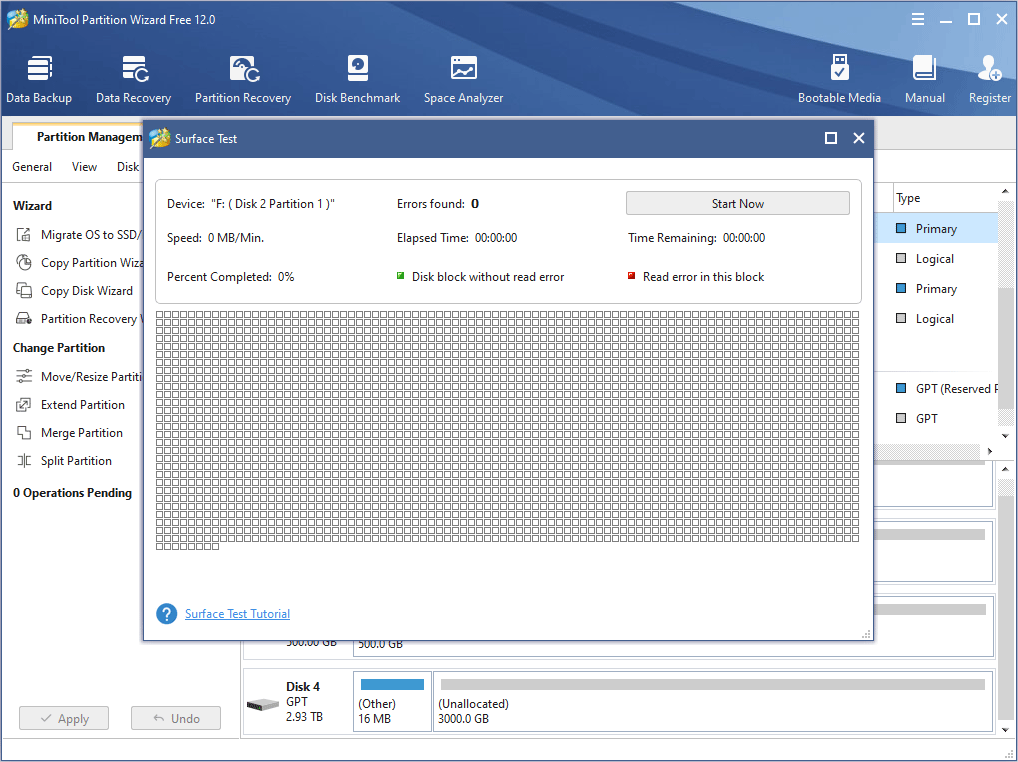
Step 4: Right-click a disk and choose Surface Test.
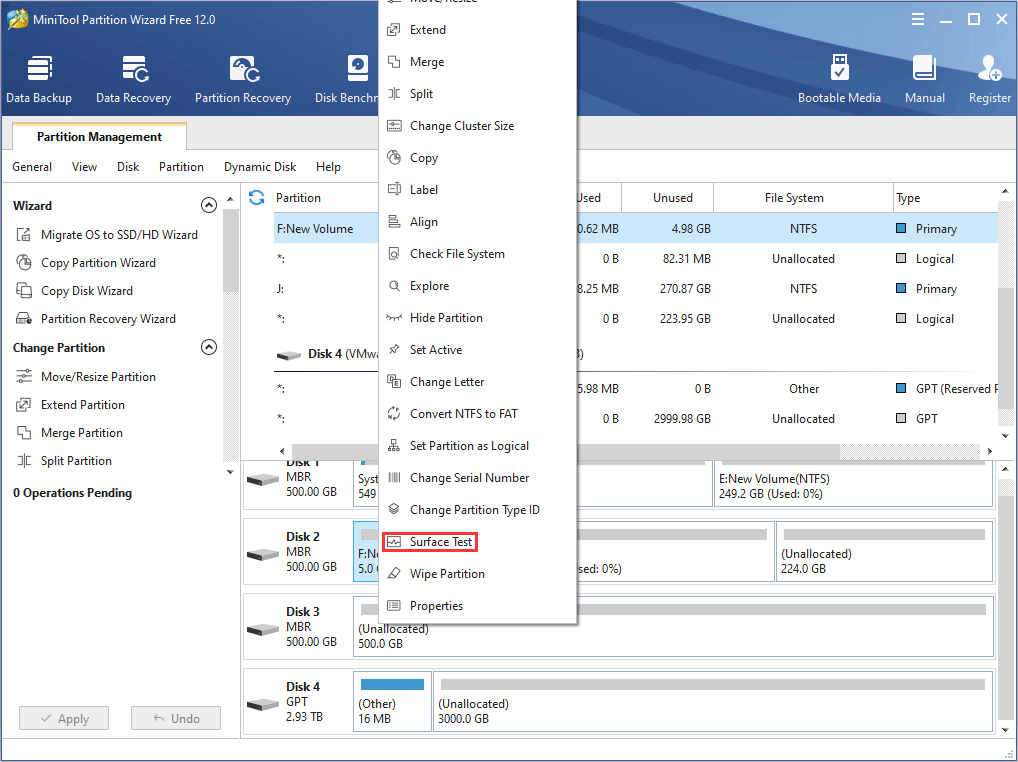
Step 5: Click Start Now to scan for bad sectors. Bad sectors will be marked with red blocks and good ones will be marked with green blocks.
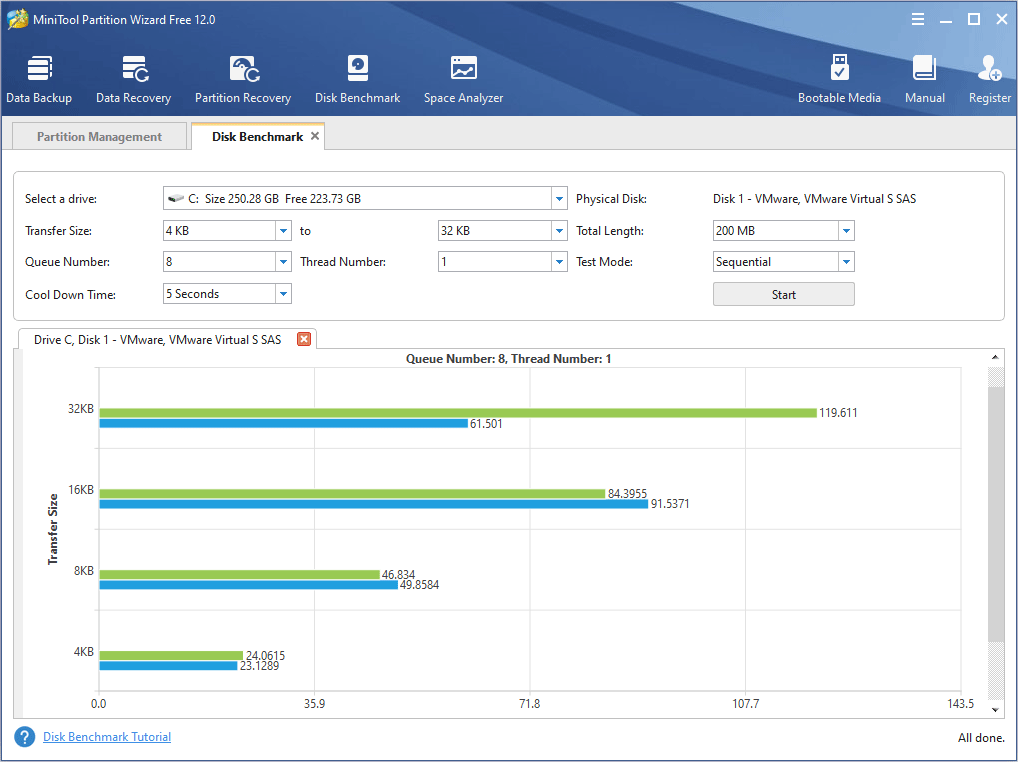
Step 6: Click Disk Benchmark on the tool bar. This feature will test disk performance.
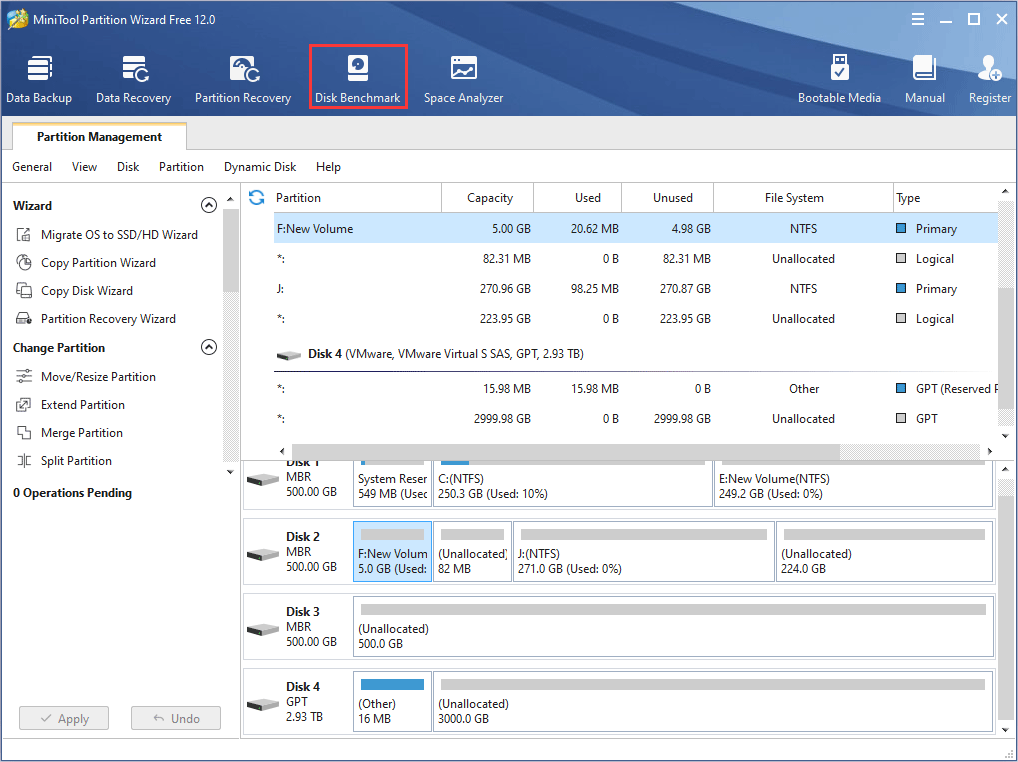
Step 7: Select a partition and set parameters. Then, click the Start button.
Step 8: After the procedure is completed, you can see the result report. Please click Disk Performance Test Guide to get the detailed result explanation.
Checking the System Performance
Apart from the above tools, Performance Monitor should also be introduced. You can use this tool to monitor system performance and diagnose hardware.
Performance Monitor
Performance Monitor is a built-in Windows performance monitor tool used for monitoring application and hardware performance in real time. It can monitor CPU, memory, network, hard disk, process, etc. You can use it to make a full computer diagnostic test.
How can we use it? Here is the tutorial.
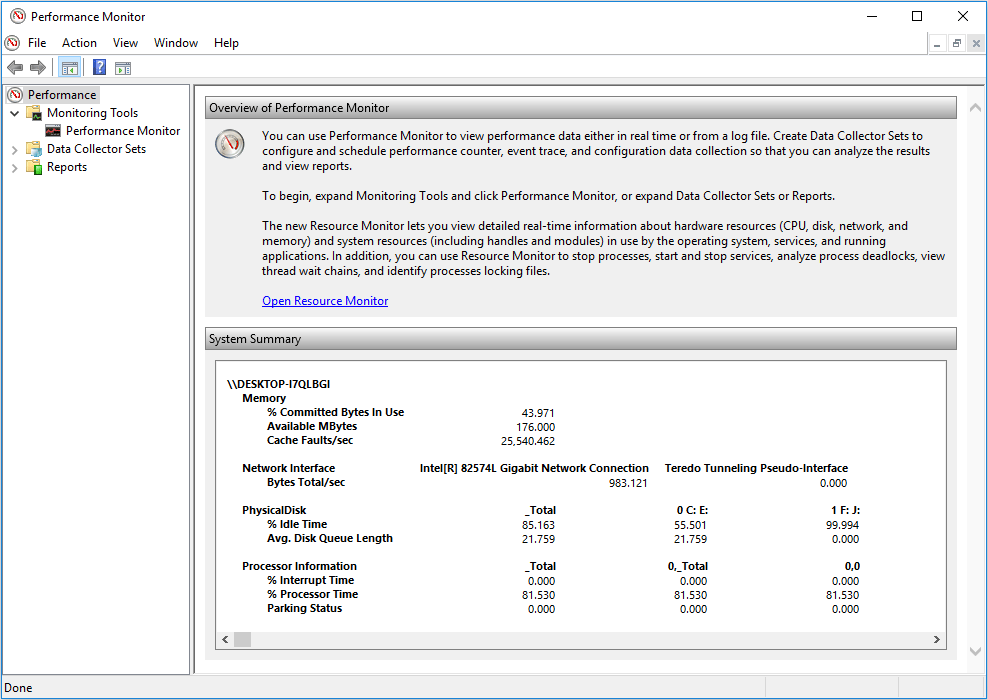
Step 1: Type “performance monitor” in Windows search box.
Step 2: Click Performance Monitor to run it. Then, you can get a system summary. If you want to monitor single hardware such as CPU, hard drive, and memory, please read on.
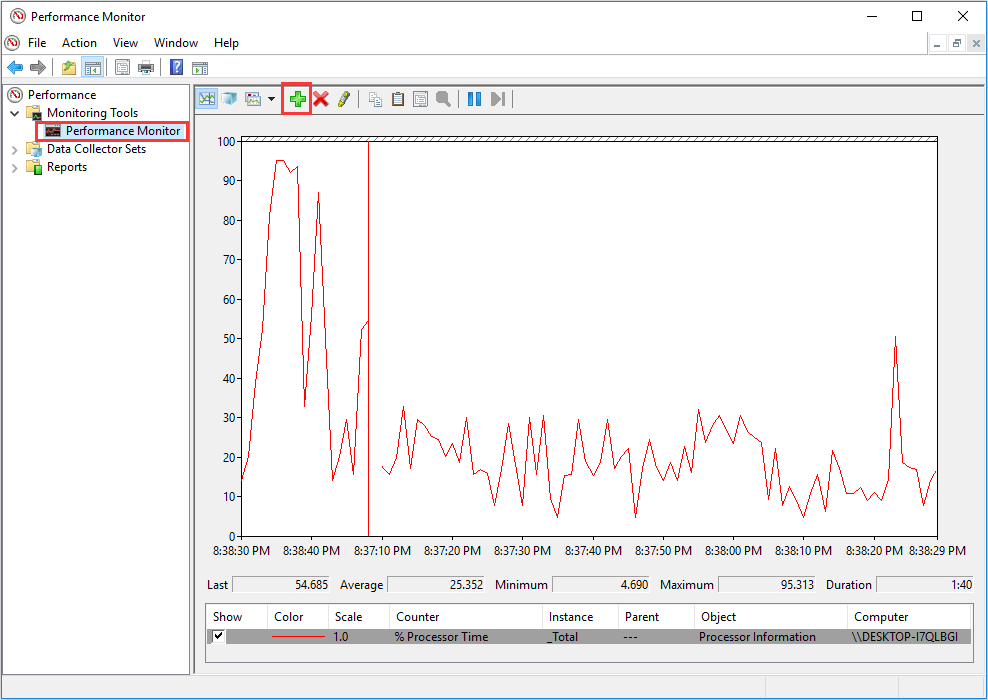
Step 3: Highlight Performance Monitor and click the “add” icon.
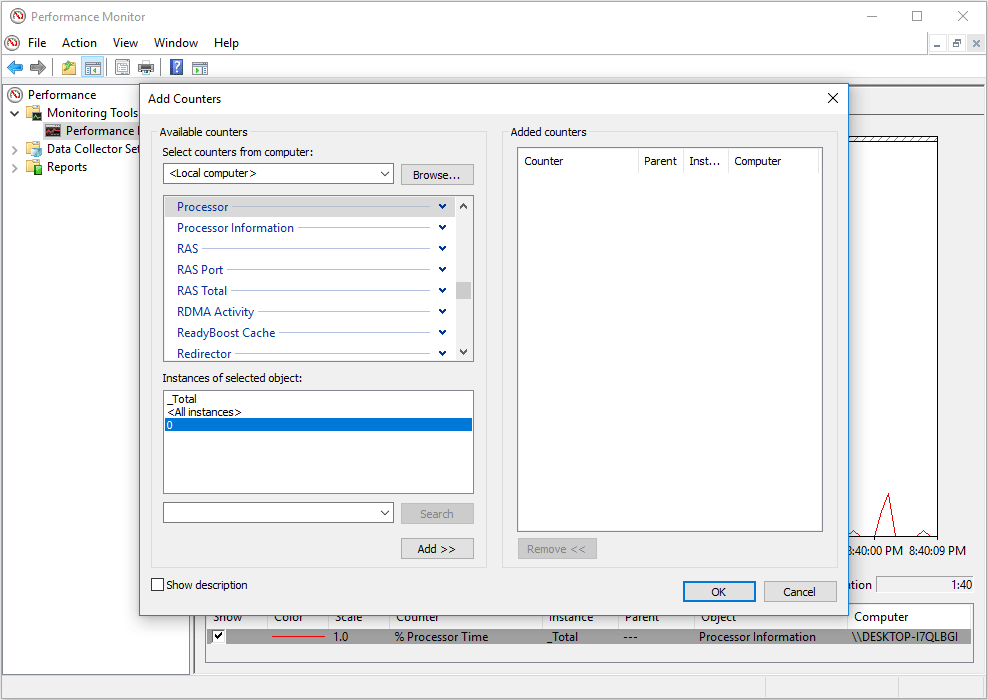
Step 4: Choose a monitor object and click the Add button and OK button.
Step 5: Finally, you can monitor the object and get the detailed information.
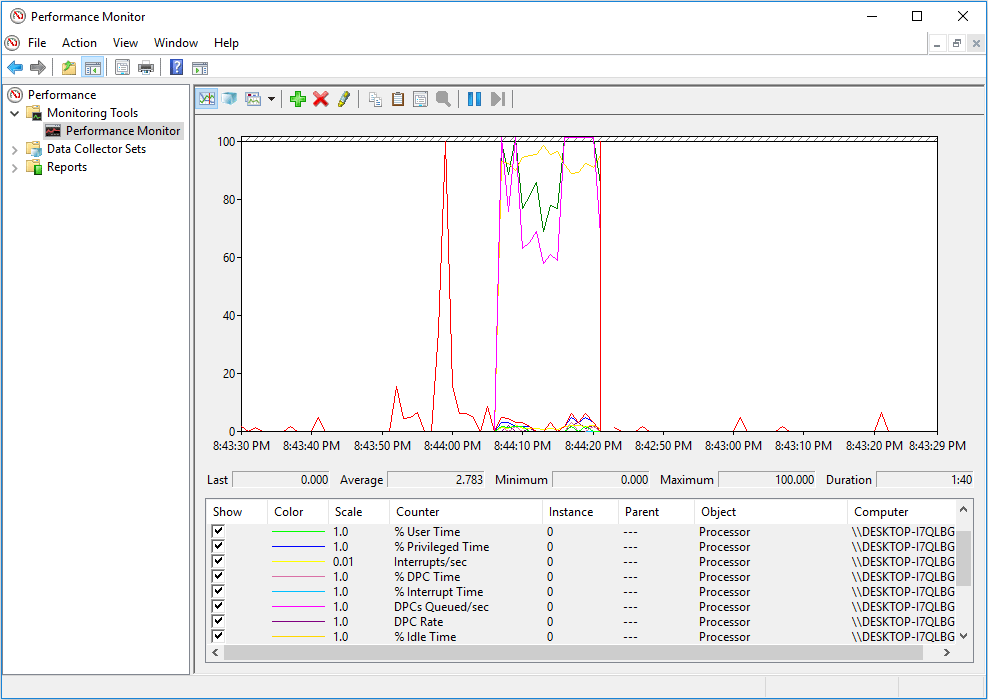
When you run a hardware test on a CPU, a memory, and a hard drive, you should pay attention to the following parameters.
- CPU
% Processor Time: It represents the percentage of time the processor spends in executing a non-idle thread. Its normal numerical value will fluctuate within the range of 80% ± 5%. A too low value means that the CPU utilization is not high enough. On the other hand, a too high value indicates that the CPU may become the processing bottleneck of the system.
Interrupts/sec: It represents the number of times when the device interrupts the processor every second. It’s the lower value, the better; and it’s best not more than 1,000.
If this value increases significantly while the system activity doesn’t increase accordingly, it means that there is a hardware problem and you need to check the network adapter, disk, or other hardware that is causing the interrupts.
- Memory
Pages/sec: Its normal value will fluctuate within the range of 0-20. This value will always be high if the server does not have enough memory to handle its workload. If it is greater than 80, it indicates a problem.
Page Reads/sec: It represents the number of times when reading from the hard disk in order to solve the hardware error. If its value keeps at 5, it means there may be insufficient memory.
- Disk
% Disk Time: It represents the percentage of time the disk spends in serving read requests or write requests. The normal value is less than 10. If the value is too large, you should consider adding memory or replacing the disk with a faster one. If the value keeps exceeding 80 while the processor and network connection are not saturated at this time, a memory leak may occur.
Avg. Disk Queue Length: It refers to the average number of reading and writing requests queued during the sample interval. Its normal value is less than 0.5. A too large value indicates that the disk inputs and outputs too slowly and you need to replace the disk with a faster one.
Bottom Line
Is this article helpful to you? Can these computer diagnostic tools solve your problem? Please give us your feedback. If you still don’t know how to use the above tools, please leave a comment below or email us at [email protected]. We will reply to you as soon as possible.
About The Author

Position: Columnist
Linda has been an editor at MiniTool for seven years. She continuously learns about computers and puts her knowledge into practice. Moreover, she is particularly knowledgeable in disk management, data recovery, system installation, and PDF editing. Her articles typically reference multiple examples or are based on her own experience, providing users with the most suitable solutions.
User Comments :